Current Real-Time Elevation
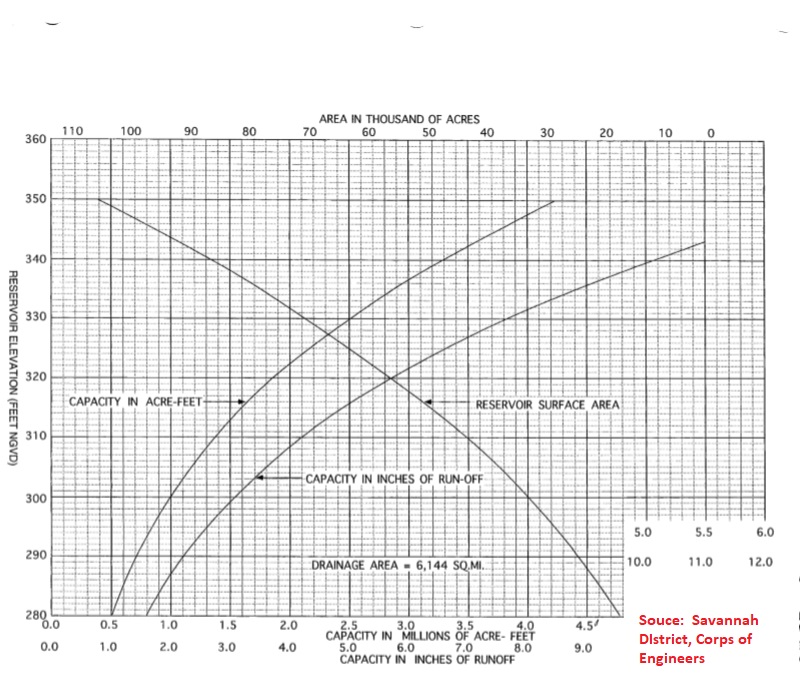
Area-Capacity Information
Text Reports - Avg, Max, Min Elevation as well generation (MWHr), inflows (cfs) and releases (cfs)
Annual (Year by year)
Monthly chronological
Monthly (Sorted Month/Year) with Rank
Ranked Inflows - Water Year, Month
Inflows By Month and Water Year with Rank By Year
High, Low, Mean Elevations By Water Year with Rank
Monthly chronological
Monthly (Sorted Month/Year) with Rank
Ranked Inflows - Water Year, Month
Inflows By Month and Water Year with Rank By Year
High, Low, Mean Elevations By Water Year with Rank
Operation Percentiles
Lake Elevation
Inflow
Release
Daily Generation (MWHR)
Thurmond Weekly Generation (MWHR)
Savannah Riv Weekly Generation (MWHR)
10 Project GA/AL/SC System Weekly Generation (MWHR)
Thurmond Weekly Generation (MWHR)
Savannah Riv Weekly Generation (MWHR)
10 Project GA/AL/SC System Weekly Generation (MWHR)
Thurmond Weekly Generation (MWHR)
Savannah Riv Weekly Generation (MWHR)
10 Project GA/AL/SC System Weekly Generation (MWHR)
Inflow
Release
Daily Generation (MWHR)
Power Production All Days of the week
Savannah Riv Weekly Generation (MWHR)
10 Project GA/AL/SC System Weekly Generation (MWHR)
Power Production Only Weeekdays (Monday - Friday)
Savannah Riv Weekly Generation (MWHR)
10 Project GA/AL/SC System Weekly Generation (MWHR)
Power Production Only Weekends (Sat and Sun)
Savannah Riv Weekly Generation (MWHR)
10 Project GA/AL/SC System Weekly Generation (MWHR)